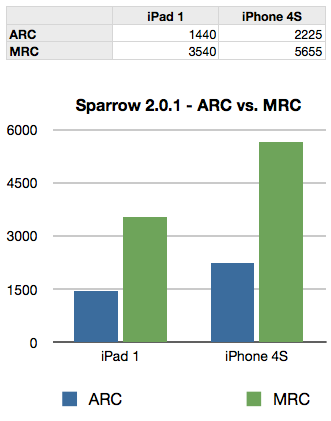
Daniel Sperl, developer of the Sparrow Framework, recently posted a performance comparison on the Apple Developer forum where Sparrow ran 2.5 times faster with MRC code than the version upgraded to ARC.
A curious finding though it seemed very far off from real world observations. Being a synthetic benchmark no less. I decided to do a similar test based on the same code comparing cocos2d v2 and v3.
Fortunately cocos2d-iphone v3 has made a similar switch from MRC (v2.1 and earlier) to ARC (v3 preview). Unfortunately the internals of cocos2d also changed to some extent, for example custom collection classes written in C were replaced by Core Foundation classes. I don’t have a full overview of the changes, but at least the renderer doesn’t seem to have changed in any significant way. Yet.
So while comparability is good, it’s not like Sparrow where truly the only changes made were converting the code from ARC back to MRC. Take the following benchmark results and comparisons with two grains of salt and pepper on the side.
ARC vs MRC
The original benchmark done with Sparrow has seen MRC perform 2.5 times better than ARC in a synthetic “draw as many sprites as possible until framerate has dropped consistently below 30 fps” test:
Or so goes the argument. Still.
I wish Apple would just pull the plug and completely remove MRC support from LLVM. I’m getting tired, annoyed and sometimes angry when I browse stackoverflow.com and frequently find MRC code samples containing one or more blatant memory management issues.
Before I rant any further, this article is about testing the performance difference of ARC vs MRC code. I provide some examples, and the updated performance measurement project I’ve used before for cocos2d performance analysis, and the results of the full run at the bottom. I also split it into both synthetic low-level tests and closer to real-world algorithms to prove not one but two points:
ARC is generally faster, and ARC can indeed be slower - but that’s no reason to dismiss it altogether.
Measuring & Comparing Objective-C ARC vs MRC performance
Without further ado, here are the results of the low-level MRC vs ARC performance tests, obtained from an iPod touch 5th generation with compiler optimizations enabled (release build): Continue reading »
When you embark on a project, the first thing a developer ought to do is to run some basic math. Especially if you already have some specs regarding the number and sizes of assets. Because otherwise you may end up trying hard to work around a memory related issue which perhaps even modern desktop computers would struggle with.
So today, I’ll do some math for you, the things you should consider before starting a project or adding one more of those big new shiny features to your app. Kind of like an addendum to my popular article about memory optimization and reducing bundle size.
How much wood texture would a woodchuck choke on if a woodchuck could choke on wood textures?
A texture is an in-memory representation of an image made up of individual pixels. Each pixel uses a certain amount of memory to represent its color. A texture’s memory size is therefore simply the product of width * height * sizeof(color).
Before I go any further, I like to stress it again: the size of an image file is much smaller than the size of the texture generated from the image. Don’t use image file sizes to make memory usage estimations.
Most common are 32-Bit and 16-Bit textures which use 4 and 2 Bytes respectively per pixel. A 4096×4096 image with 32-Bit color depth therefore uses 64 MB memory. Let that sink in for a moment …
At 16-Bit it only uses half of that, though without color dithering (TexturePacker does this for you) this might not look too good depending on the image.
This is pretty much what you’re stuck with unless you export textures as .pvr.ccz. Not only does this format load tremendously faster than PNG (not to speak of JPG which are unbearably slow to load in cocos2d), the .pvr.ccz format also reduces the texture memory size because the texture can stay compressed in memory.
It’s extremely difficult to estimate how much smaller a PVR texture’s memory footprint will be without actually giving it a try. But you can expect anywhere between 10% to 50% reduction.
To the non-power-of-two!
 I’m currently working on a new tilemap renderer for KoboldTouch.
I now have an early version that’s fairly complete and does most of what cocos2d’s tilemap renderer can do. Pun intended: yes, cocos2d’s tilemap renderer really doesn’t do all that much: load and display tilemaps with multiple layers.
In fact my current implementation is one step ahead already:
KoboldTouch’s tilemap renderer doesn’t require you to use -hd/-ipad/-ipadhd TMX files and the related (often hard to use or buggy/broken) TMX scaling tools. Just use the same TMX file designed for standard resolution, then simply provide just the tileset images in the various sizes with the corresponding -hd/-ipad/-ipadhd suffixes. The tilemap looks the same on a Retina device, just with more image detail.
Performance Comparison
Anyhow, I thought I’ll do some quick performance tests. I have a test map with 2 layers and a tiny tileset (3 tiles, 40×40 points). I’m comparing both in the same KoboldTouch project, using the slim MVC wrapper (named KTLegacyTilemapViewController) for cocos2d’s tilemap renderer CCTMXTiledMap. Continue reading »
Due to technical issues (blank page) I had to split the previous article (now focuses only on memory optimization) in two. This is the second part which (mostly) focuses on reducing the app bundle size.
Loading Assets In Sequence
Here’s the code that I use to load textures or other assets asynchronously (in background, on another thread).
Imagine loadAssetsThenGotoMainMenu being a scheduled method that runs every frame or perhaps less often. The assetLoadCount and loadingAsset variables are declared in the @interface as int and BOOL respectively.
|
1 2 3 4 5 6 7 8 9 10 11 12 13 14 15 16 17 18 19 20 21 22 23 24 25 26 27 28 29 30 31 32 33 34 35 36 37 38 39 40 41 42 |
-(void) increaseAssetLoadCount { assetLoadCount++; loadingAsset = NO; } -(void) loadAssetsThenGotoMainMenu:(ccTime)delta { NSLog(@"load assets %i", assetLoadCount); switch (assetLoadCount) { case 0: if (loadingAsset == NO) { loadingAsset = YES; NSLog(@"============= Loading home.png ==============="); [CCTexture2D setDefaultAlphaPixelFormat:kCCTexture2DPixelFormat_RGB5A1]; [[CCTextureCache sharedTextureCache] addImageAsync:@"home.png" target:self selector:@selector(increaseAssetLoadCount)]; } break; case 1: if (loadingAsset == NO) { loadingAsset = YES; [self performSelectorInBackground:@selector(loadSpriteFrames:) withObject:nil]; } break; // extend with more sequentially numbered cases, as needed // the default case runs last, loads the next scene default: { [self unscheduleAllSelectors]; MainMenuScene* mainMenuScene = [MainMenuScene node]; [[CCDirector sharedDirector] replaceScene:mainMenuScene]; } break; } } |
When this method runs the first case statement is executed. To avoid accidentally loading the same image multiple times every time the selector runs, the loadingAsset flag is set to YES. When the texture cache has completed loading this texture, it will call the increaseAssetLoadCount. This then ensures that the next case statement is executed the next time loadAssetsThenGotoMainMenu runs.
The cool thing about this solution is that you can easily add more switch statements to add more textures to load. Because the default case is where the scene changes, and that only happens if there are no more switch cases to process.
Be sure not to skip a number in the switch cases because that will also run the default case.
Decreasing the size of your app
Besides the memory usage advantage, reducing the color bit depth of textures to 16 bit will also significantly reduce their size. But there are other options that will allow you to reduce your app’s size, perhaps significantly.
TexturePacker PNG Optimization
If for some reason you still want to use PNG files instead of the highly recommended .pvr.ccz file format, TexturePacker has a slider named “Png Opt Level” to help reduce the size of PNGs (doesn’t affect loading time though):

As far as I understand it, it tries a given number of optimizations and picks the one that creates the smallest file size. The downside is that the maximum level can take very long for large texture atlases, in some cases 10 to 20 minutes on a Late 2009 27″ iMac. The task is multi-threaded, so it should be a lot faster on quad core systems.
Fortunately there’s really no need to do this unless you’re ready to release the app. Question is, how much can it reduce the size of PNG files? Continue reading »
I’m currently completing one last contract project. One of the last things I had to deal with was to optimize the game’s memory usage.
In today’s iDevBlogADay article I’ll explain how I was able to cut down memory usage by about 25-30 MB (down to 90-95 MB, ie fixing memory warning related crashes) as well as reducing the size of the app bundle from around 25 MB to below 20 MB (which would have been more awesome if Apple hadn’t already increased the over-the-air download limit from 20 MB to 50 MB some time ago).
I’ll also explain how to animate the loading screen while you’re loading resource files, and I’ll add some best practices and common wisdom too.
What’s using 90% of the memory?
Take a guess.
In almost all cases, it’s textures that consume most of the app’s memory. So textures is where you look to optimize first and foremost if you’re having memory warning troubles.
Avoid loading PNG/JPG Textures one after another
The problem with texture loading in cocos2d is that it happens in two steps: first, a UIImage is created from the image file. Then a CCTexture2D object is created from that UIImage. This means while a texture is being loaded, it will consume twice as much memory for a short time period.
The problem used to be so bad that if you loaded 4 textures one after another in the same method, at the end of the method each texture would still consume twice as much memory as it ought to, probably because of the way autorelease works.
I’m not sure if this is still the case, or whether this only applies to manual reference counting but not ARC. I made it a habit to load textures in sequence, waiting at least one frame before trying to load another. This will allow any texture loading overhead to be released from memory. Besides, as you’ll see later, if you want to load textures and other assets in the background this asset-load-sequencing is something you’ll do anyway.
This continues and concludes the previous post of the Fast Pixel-Perfect Collision Detection for Cocos2D with Example Code (1/2) article.
Have a look at the following code, and then answer these questions before reading on:
- Which function will run faster?
- What will be the framerate for each function when run 100 times per frame on an iPhone 3G?
- Will wrapping the 100 calls to function1 in an NSAutoreleasePool show any difference?
[cc lang=”ObjC” height=”465″]
-(void) function1
{
CGPoint pos = [self position];
id x = [NSNumber numberWithFloat:pos.x];
id y = [NSNumber numberWithFloat:pos.y];
id objects = [NSArray arrayWithObjects:x, y, nil];
id keys = [NSArray arrayWithObjects:@”x”, @”y”, nil];
id dict = [NSDictionary dictionaryWithObjects:objects forKeys:keys];
dict; // avoid compiler warning, is a noop
}
-(void) function2
{
CGPoint pos = [self position];
id x = [[NSNumber alloc] initWithFloat:pos.x];
id y = [[NSNumber alloc] initWithFloat:pos.y];
id objects = [[NSArray alloc] initWithObjects:x, y, nil];
id keys = [[NSArray alloc] initWithObjects:@”x”, @”y”, nil];
id dict = [[NSDictionary alloc] initWithObjects:objects forKeys:keys];
[x release];
[y release];
[objects release];
[keys release];
[dict release];
}
[/cc]
The Answers
- Which function will run faster? Answer: function1
- What will be the framerate for each function when run 100 times per frame on an iPhone 3G? Answer: 27 fps for function1 and 24 fps for function2.
- Will wrapping the 100 calls to function1 in an NSAutoreleasePool show any difference? Answer: no, but memory of temporary objects is released immediately.
Needless to say, on an iPod (4th Generation) and an iPad these tests all run at 60 fps and give no indication whatsoever that the performance on an iPhone 3G would suffer this much (and neither does the Simulator, of course). All the more reason to test early and often on older devices.
To autorelease or not?
Common wisdom may tell you that alloc/release is faster than autorelease. Even Apple recommends avoiding autorelease, right?
Not quite, because this is often misunderstood: Apple recommends to avoid autorelease but only for functions which create a lot of temporary objects and because of the constrained memory - not because it’s slow or even dangerous - autorelease is not dangerous.
Since memory is so constrained on 1st and 2nd generation iOS devices, it’s best to release that memory as soon as possible and don’t leave it allocated for longer than necessary. To achieve this, you can choose to do two things in this case: use alloc/release or enclose the loop in an NSAutoreleasePool. The latter option is preferred since it will release the memory right away, and not some time later. And autorelease is generally preferable because you will never, ever forget to send a release message to an object - which means it’ll be leaked and forever use up memory.
You can write well-performing, even better-performing code by using autorelease and using NSAutoreleasePool around tight loops creating many temporary autorelease objects.
Innocent looking code kills framerate
Did you expect that creating 100 rather simple NSDictionary instances each frame would drag the framerate down to around 24-27 fps? Me neither. I knew the code wasn’t going to be blazing fast, but I never expected it to have such an impact. However, it can be optimized somewhat since I’m unnecessarily creating two NSArray instances to hold the keys and values respectively before using them to create the NSDictionary. In fact we can get rid of them by using dictionaryWithObjectsAndKeys and doing this in a single step:
[cc lang=”ObjC”]
-(void) function1Optimized
{
CGPoint pos = [self position];
id x = [NSNumber numberWithFloat:pos.x];
id y = [NSNumber numberWithFloat:pos.y];
id dict = [NSDictionary dictionaryWithObjectsAndKeys:x, @”x”, y, @”y”, nil];
dict; // avoid compiler warning, is a noop
}
[/cc]
Sometimes it helps to look around what other ways there are to run the same code. In terms of performance this is an order of a magnitude faster and now clocks in at 42 fps. Still not good enough for realtime rendering obviously but an improvement of over 50% by cutting two NSArray allocations is a very simple and effective optimization.
Just as a general guideline, when I get rid of the two NSNumber instances and simply pass empty strings for x and y the framerate went back up to 60 fps. Of course that’s over-optimizing to the point where the code doesn’t work anymore. It just goes to show how expensive the creation of NSDictionary and NSArray are, as is wrapping simple types in NSNumber or NSValue objects.
If you can avoid allocation and temporary objects, avoid it. If you can’t, at least avoid creating temporary objects every frame. Re-use objects as much as possible. Unfortunately, that’s not an option for NSNumber objects since you can’t change the value of a NSNumber instance.