I took Mike Ash’s performance measuring code from 2008 with the improvements made by Stuart Carnie in early 2010 and turned that into a performance measuring project for 2012.
I know it’s still 2011, consider this a forward-looking statement. In any case, the test project is available for download, ready to run, includes Cocos2D v1.0.1 and is relatively easy to modify for your own needs. This project is also available on my github repository where I host all of the iDevBlogADay source code.
Since numbers are so dry and hard to assess, you’ll find the rest of this post garnered with charts and conclusions based on the results obtained from iPhone 3G, iPod 4 and iPad.
- About the Test Project
- Comparing the Devices (iPhone 3G, iPod 4, iPad)
- How image formats influence loading times
- Re-visiting CCArray Performance
- Cocos2D: How children count can affect performance
- Cocos2D: How long it takes to create nodes
- A word of caution for the Tilemappers
- Summary
About the Test Project
At heart, the project still uses Mike Ash’s PerfTester class. I introduced various test categories that can be run independently, this makes it easier to focus on just one particular line of tests you’re currently interested in evaluating. Thus you can simply comment out individual test sections:
[cc lang=”cpp”] pt = [[PerfTester alloc] init];
pt.quickTest = NO;
[pt test:kkPerformanceTestArray];
[pt test:KKPerformanceTestObjectCreation];
[pt test:KKPerformanceTestTextureLoading];
[pt test:kkPerformanceTestNodeHierarchy];
[pt test:KKPerformanceTestMessaging];
[pt test:kkPerformanceTestArithmetic];
[pt test:kkPerformanceTestMemory];
[pt test:KKPerformanceTestIO];
[pt test:kkPerformanceTestMisc];
[pt printResultsToStandardOutput];
[pt showResultsInView:[CCDirector sharedDirector].openGLView];
[/cc]
While running, the test status is printed to the Xcode Debug Console (View -> Debug Area -> Activate Console), and when all tests are completed, you’ll find an HTML formatted result that you can paste into an html file. But I found that rather inconvenient, so I decided to fancy this up a little and present the results on the device inside a UIWebView (see screenshot).
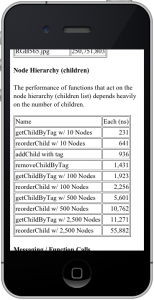 A full test takes roughly around 15 minutes to complete, but there’s the option to run a quick test, reducing the number of iterations and thus reducing the accuracy of the results. The PerfTester class now also detects if it is running on an ARMV6 (1st & 2nd generation) device and automatically reduces the number of iterations to complete the tests within a reasonable time frame. On my iPhone 3G it actually took only 12 minutes to complete a full test, whereas the iPod 4 worked on the tests for 17 minutes. Quick tests cut down that time to about a third (4-6 minutes).
There’s two additional things you should be aware of when running the project. First, don’t run it on the iOS Simulator. I mean, what are you testing, really? How fast your Mac can run the iOS Simulator, no more, no less. So that’s pretty pointless and the projects makes that very clear in the results. You’ll see.
Secondly, the results were obtained with optimizations turned off. The problem with optimized code is that the tight test loops may be optimized in such a way that the tests aren’t actually performed. For example, there’s a good chance that the compiler will simply not execute the code within a loop if that code does not change the state of the program. I did remove the DEBUG macro though and turned off Cocos2D debug logging as well. I also disabled breakpoints for the test runs since simply having breakpoints enabled could influence the test performance.
But enough of that, on to the test results. Unless otherwise stated, all timings are in nanoseconds.
Comparing the Devices (iPhone 3G, iPod 4, iPad)
One conclusion I can give you right away: while the newer devices are magnitudes faster (ie 5-10x) than an iPhone 3G, the relative performance differences of the various tasks that were tested remained almost unchanged. So if Task A is 30% faster than Task B on an iPhone 3G, it is in all likelihood still around 30% faster on the iPod 4 and the iPad.
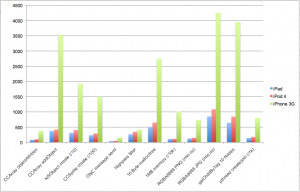
But, as expected, when you do compare the same task across multiple devices there are clearly many areas where the iPhone 3G simply can’t compete with the iPod 4 and iPad:
Note: the tests in this diagram use different scales, you can not compare the individual tests with each other. For example, the “CCSprite create” results are scaled down by a factor of 100 so that the columns fit within the range of the chart.
While iPod 4 and iPad play about in the same ballpark, the iPhone 3G is up to 8.5 times (CCArray addObject, 1MB memcpy) slower than the iPod 4. In other areas however the difference shrinks to 3.5 times (ObjC message send) and an almost negligible 1.2 times slower for the Accelerometer Highpass filter test. The latter is particularly interesting because the highpass filter is entirely an arithmetic test consisting of 6 multiplications and 9 additions/subtractions of double values.
Surprisingly, in the purely arithmetic tests (multiplication, division, addition, subtraction, square root, accelerometer filtering) the iPhone 3G can still compute in the same league as the iPad and iPod 4. What’s breaking the iPhone 3G’s neck is of course the much slower memory performance, and for games obviously the rendering performance as well.
How Image Formats influence Loading Times
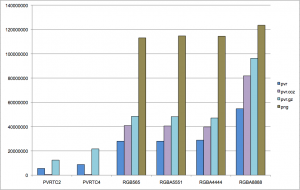
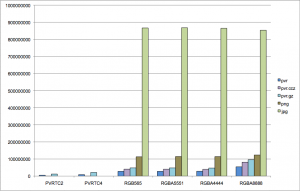
Thanks to TexturePacker I created a 1024×1024 texture atlas in a great variety of image formats, image compression and color bit depths. Namely JPG, PNG, PVR, PVR.CCZ and PVR.GZ as compressed PVRTC2 (2-Bit) and PVRTC4 (4-Bit) and regular RGB565 (16-Bit, no alpha), RGB5551 (16-Bit, alpha on/off), RGBA4444 (16-Bit, 4-Bit alpha) and RGBA8888 (32-Bit, 8-Bit alpha). Without further ado, here’s the chart that shows how the image formats compare to each other (loading times):
Clearly the PVRTC2 and PVRTC4 file formats blow all others away in terms of loading times. And in particular the bars for the PVR.CCZ format are barely visible. It’s incredible how fast PVR.CCZ files can be loaded on the device - but only if you’re using the lossy PVRTC formats. The fast results may also indicate some kind of issue (ie failure to load the image) which I didn’t verify, so take these particular numbers with a grain of salt.
For the 16-Bit and 32-Bit image formats the basic PVR format is the fastest, and even faster than PVR.CCZ and especially PVR.GZ. The PVR.GZ format is the slowest PVR format and one you will want to avoid because it’s not just the slowest, it’s also losing in terms of file size by a tiny margin (2%) against PVR.CCZ.
Speaking of file size: that’s the one factor that makes the PVR.CCZ the most attractive format throughout, even though 16/32-Bit PVR images load faster. But when you consider that the RGBA4444 image is 2.1 MB in PVR format but only 82 KB as PVR.CCZ then that tradeoff is speaking clearly in favor of PVR.CCZ. The PNG version comes close in terms of file size (123 KB) but clearly loses in terms of loading performance. Only JPG comes close in terms of file size with 122 KB for that format, and with RGBA8888 JPG size is only 120 KB compared to 230 KB for PVR.CCZ and 270 KB for PNG.
Speaking of JPG, why isn’t that in the chart above? Well, it would have made the chart difficult to read because JPG loading times simply blow (or suck, whichever you prefer). Here’s the same chart with JPG loading times added:
The chart reads as follows: Don’t use JPGs! Like, ever.
Re-visiting CCArray Performance
It’s been over a year since I last compared the performance of CCArray with NSArray and NSMutableArray. While doing these tests I found that CCArray’s insertObjectAtIndex and removeObjectAtIndex had a severe performance problem, so I wanted to test this against the NSMutableArray that Cocos2D used to use internally until NSMutableArray was replaced with CCArray.
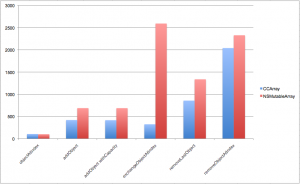
First let’s have a look at the fast routines that take less than 3,000 ns to complete:
One relatively important method objectAtIndex performs exactly the same for both arrays. Adding objects is around 1.6 times faster for CCArray. Exchanging objects is clearly well optimized in CCArray, but I doubt it’s used much.
The positive takeaway from this chart is that the average performance for removeObjectAtIndex is now slightly faster than NSMutableArray, and no longer magnitudes slower. That may also depend on the way I tested it this time however. Last time, I removed the object at index 0 and used a relatively large array. This time I removed the object at index 500 for an array containing 1000 objects while also adding the removed object again so that the test can run any number of iterations.
Ultimately the CCArray removeObjectAtIndex performance still depends on the index and the number of elements in the array. If the index is low and the number of elements in the array is large, the NSMutableArray will be faster. For example, when using index 5 for this test then NSMutableArray’s removeObjectAtIndex is 1.25 times faster than CCArray.
But so far this is looking good for CCArray. Now let’s have a look at the slower operations that take up to 250,000 ns to run:
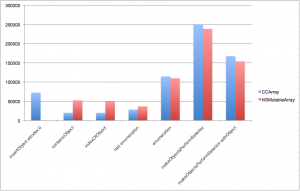
The containsObject and indexOfObject tests are a clear win for CCArray, and those methods are used fairly frequently I suppose. Fast enumeration is also a win for CCArray albeit a small one. Fast enumeration for CCArray means using the CCARRAY_FOREACH(array, object) {} macro since CCArray does not support the cleaner and standard for (id object in array) {} fast enumeration construct.
Overall, CCArray performance is still looking good even though it lags slightly behind for regular enumeration (for loop using objectAtIndex:i) and makeObjectsPerformSelector. But just by the complete absence of the red column for insertObjectAtIndex:0 it becomes clear that CCArray is still having that particular performance problem.
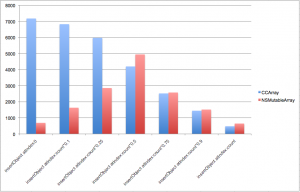
Or is it? I started to wonder what the results would be like if I tested insertObjectAtIndex with varying indexes. Since this test inserts new objects to an ever growing array I decided to base the index on [array count] and multiply that with factors 0.0, 0.1, 0.25, 0.5, 0.75, 0.9 and 1.0. These are the rather odd looking results:
So why is the performance characteristic for CCArray a linear one, while that of NSMutableArray has its peak when inserting objects exactly at the middle of the array?
Whenever you have to insert an object into an array, all the objects at the following indexes need to be shifted up by one. Normally this is done by simply copying that block of memory. That is also why CCArray is slowest when inserting objects at index 0 - this requires the entire array to be copied in memory.
The fact that this doesn’t happen with NSMutableArray points to a clever optimization: depending on where you insert a new object, NSMutableArray will either shift the remaining objects up, or the previous objects are shifted down if the index is smaller than half of the number of elements in the array. In other words, the NSMutableArray is able to grow in both directions, whereas CCArray (currently) is only able to grow in one direction.
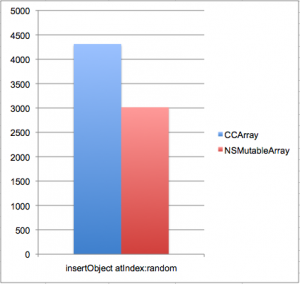
Following this revelation I wanted to know what the overall average performance for insertObjectAtIndex is by using a randomly calculated index via [array count] * CCRANDOM_0_1() and seeding the randomizer with srandom(1234567890) to ensure that for both tests the same sequence of random numbers is used.
The result is a relatively clear win for NSMutableArray. Maybe some clever coder can add the kind of NSMutableArray optimization to CCArray to speed up insertObjectAtIndex as well as possibly removeObjectAtIndex.
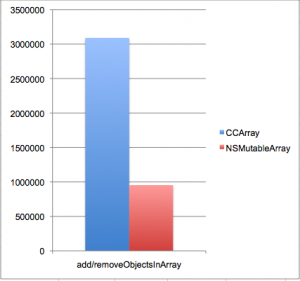
Finally, there’s another clear win for NSMutableArray, which is addObjectsFromArray and removeObjectsInArray. These methods add or remove objects from the array by providing an array of objects. Probably not often used and knowing that CCArray is about 3 times slower in that test it’s probably a good idea to avoid this for performance critical code paths.
Cocos2D: How children count can affect performance
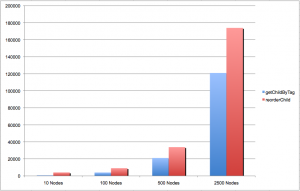
The CCNode methods getChildByTag and reorderChild depend heavily on how many children the node contains. To illustrate that, I ran the same test for each of these methods through a node that has 10, 100, 500 and 2500 nodes. Somewhere between 500 and 2500 nodes the runtime of these methods explodes.
I don’t expect anyone having a node with more than 500 child nodes. But if you do, now might be a good time to reconsider your design.
Cocos2D: How long it takes to create nodes
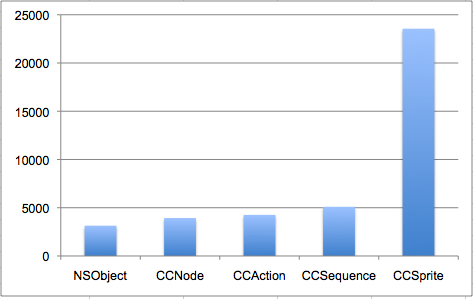
I thought it would be interesting to see how long it takes to allocate and initialize various Cocos2D node classes. Let’s start with the basic classes NSObject, CCNode, CCAction (CCMoveTo in this case), CCSequence and CCSprite.
It should be noted that for CCSprite I used the initWithFile initializer and I made sure that the texture that was used was already loaded into CCTextureCache, to avoid measuring the loading time of the texture which wasn’t the goal of this test.
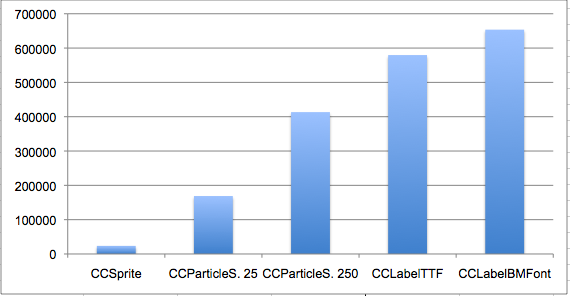
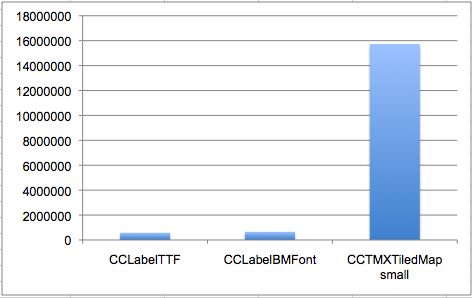
Notably creating a CCSprite is already relatively costly compared to the lightweight CCNode, CCActions or NSObject for that matter. For the next diagram I’ll leave the CCSprite in just to give you a frame of reference how the following charts scale up. In this chart there are two CCParticleSystemQuad, one initialized with 25 particles and the other with 250 particles. Following that is CCLabelTTF and CCLabelBMFont with a “Hello World!” string and using the Arial 14 font. Again I made sure that the bitmap font texture was already cached.
While CCLabelBMFont is many times faster than CCLabelTTF when you change the label’s text (via setString) it is still a bit slower to create. For any of these objects it would be wise not to create them on the fly but in advance or by re-using them from a common pool. The more particle effects or labels you create dynamically at runtime the more the simple creation of these objects will have an impact on the performance.
Moving on to loading Tilemaps, in this case a tilemap using tiles that are 32×32 pixels each and containing 200×200 tiles in one layer.
Even though the tilemap is very rudimentary and relatively small, it takes so long to load the tilemap that we’re now leaving the realm of nanoseconds and can actually express the time to load this tilemap in seconds: 0.0157 seconds.
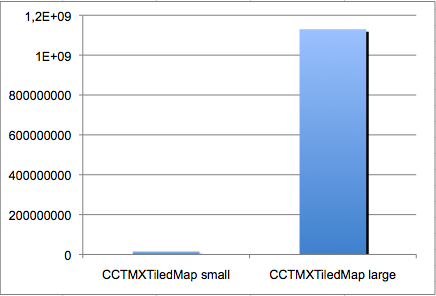
That leaves one more test to be analyzed. What if, like so many users before, you were to create an absurdly large tilemap? I simply changed the dimensions of the tilemap from 200×200 tiles to 2,000×2,000, not minding for a moment the immense slowdowns I experienced working with such a large map in Tiled.
The large (huge) tilemap takes several orders of a magnitude longer to load. In fact, it takes 1.129 seconds to load the 2,000×2,000 tilemap on an iPad. It takes over 6 seconds to load on an iPhone 3G. And we’re not even discussing the runtime, rendering performance of such a map, which will be terrible. Let’s just say Cocos2D isn’t known for its highly optimized tilemap renderer.
A word of caution for the Tilemappers
I know from various forum posts that people are actually attempting to create tilemaps not with 4-digit but even 5-digit dimensions, and of course multiple layers. Right.
So I tried to test this with a 20,000×20,000 tilemap (still just a single layer) but that was not only immensely slow to load, it would also fail to load each time after a while. There’s simply not enough memory on a device to load a tilemap that large. I pulled out my calculator to find out what the least amount of memory a tilemap this large would require…
The answer is mind-blowing: One point five gigabytes!
Now, just for those who still think that maybe a 5,000×5,000 tilemap would work - well, it might but it probably won’t. Here’s why:
5,000 x 5,000 equals 25 million. You need to store at least the indices of each tile, that means 4 Bytes (integer) per tile as the absolute minimum storage requirement (and as it turns out that is what Cocos2D does). Take 4 times 25 million and divide that by 1,048,576 to get the result in megabytes, and lo and behold there’s still a whopping 95 MB required just to store each tile’s integer index.
Although 95 MB is within the reasonable limits of modern devices. You can expect to have 80-90 MB of free memory on an iPod 4 or iPad that you can use without frequently receiving memory warnings. Problem is, you will want to spend some memory on other things as well. How about textures? That means that somewhere around 1,000×1,000 is the limit for a tilemap on today’s iOS devices, assuming you want to actually run a game on it and have multiple tile layers.
Summary
Oh no, I’m not going to sum this up. I can’t see any more numbers or column charts for the time being. 
But do let me know if you made some interesting additions to the test project. And tweet, like and plus-one this post if you found it helpful, instructive, or full of charts and numbers. Thank you!
Also, here’s the download link again for the Performance Test Project (7 MB) as well as the example results from my devices. This project is also available on my github repository where I host all of the iDevBlogADay source code.
| Follow @gaminghorror | Follow @kobold2d |
|









[…] learn-cocos2d.com の cocos2d パフォーマンステストが凄い! 2011/11/16 TweetIn Depth iOS & Cocos2D Performance Analysis with Test Project | Learn & Master Cocos2D Gam… cocos2d の パフォーマンスに関する、Steffen Itterheim (gaminghorror) on Twitter […]
Nice analysis. There are a few things changed in cocos 1.1 though. The reorder/add child routines are much faster now. There’s also a faster alternative for tiled maps, called HKTMXTiledMap. It’s limited to orthogonal maps though. It would be interesting if these changes could be tested as well in a future performance analysis.
[…] not be used, since it will save the file as JPG. I’ve explained in an earlier blog post why JPGs are the worst possible file format for iOS devices: JPGs are terribly slow to load. PNG is the preferred format. For CCRenderTexture JPG and PNG are […]
First of all, I would like to thank you for the very useful and readable performance analysis with different dimensions you did, really excellent.
I would like to propose a small addition to the test for tileMap, you were giving that the storage will be so high for only the indexing of tiles, what if we use the same tile map dimensions but with different tile size “Bigger”, will it improve the performance, because less number of tiles are there, but the tile map size is the same ?
That might help people having a large maps.
I noticed one thing, that in my game “Panda Escape” http://bit.ly/PandaEscape
The tile map size had a huge impact on performance with Box2D, but currentlyI am doing another game also using Tiled map but with Cocos2d “No Physics” so I noticed that the size of tile map has very less impact on performance, any idea why ? Is Physics related to the tile map size ?
Looking forward for your analysis.
Thanks In Advance
“Large tilemap” refers to tilemaps having a large number of tiles, not having a large size in pixels. Of course you could create a tilemap easily with big dimensions if you use a bigger tile size, but there are limits to that too. For example, assuming the texture atlas with the tile images is 1024×1024 and each tile is 128×128 pixels then the tilemap layer is limited to 64 different tile graphics for each tilemap layer.
Your issue with Box2D sizes could very well stem from Box2D being optimized for shapes that are about 1 meter in diameter (1.0f unit in Box2D, meters is just an approximation of scale). So that may be one issue that affects performance. But obviously, if you have a tilemap with physics and one without physics, the latter one is going to be a lot faster simply because there’s no physics involved. In addition, a phyiscs tilemap could use a brute force implementation that creates a box2d box shape for each tile, or it could optimize this to create box shapes for multiple shapes where possible. This optimization could also considerably affect performance. For example, if you have a platform that’s 10×2 pixels in size and rectangular, the unoptimized version creates 20 Box2D bodies whereas the optimized version would create only one.
[…] the JPG to be converted to PNG on the fly. That means cocos2d-iphone loads JPGs extremely slowly as you can see here and a JPG will use three times as much memory while the image is being […]
[…] I provide some examples, and the updated performance measurement project I’ve used before for cocos2d performance analysis, and the results of the full run at the bottom. I also split it into both synthetic low-level tests […]